TOEIC Reading Practice Test: Interpreting Graphs in Market Trend ReportsPart 1: Incomplete Sentences
-
The line graph shows a steady __ in sales over the past quarter.
A. increase
B. decrease
C. fluctuation
D. stagnation
-
According to the pie chart, the largest market __ belongs to Company X.
A. share
B. segment
C. portion
D. slice
-
The bar graph __ the differences in revenue among the top five competitors.
A. illustrates
B. demonstrates
C. exhibits
D. portrays
-
The __ axis of the graph represents the time period in months.
A. vertical
B. horizontal
C. diagonal
D. perpendicular
-
The report indicates a __ correlation between advertising expenditure and sales growth.
A. positive
B. negative
C. neutral
D. inverse
-
The scatter plot __ a clear relationship between customer satisfaction and repeat purchases.
A. reveals
B. conceals
C. distorts
D. exaggerates
-
The __ point on the graph indicates the highest sales volume for the year.
A. peak
B. trough
C. median
D. mean
-
The trend line suggests a gradual __ in market share over the next five years.
A. expansion
B. contraction
C. stabilization
D. volatility
-
The histogram __ the distribution of customer ages across different product categories.
A. displays
B. hides
C. manipulates
D. misrepresents
-
The __ in the graph represents the point at which supply meets demand.
A. intersection
B. junction
C. crossroads
D. convergence
-
The report __ several key factors that contributed to the market’s growth.
A. identifies
B. ignores
C. overlooks
D. undermines
-
The area chart effectively __ the cumulative effect of multiple variables on total sales.
A. showcases
B. obscures
C. diminishes
D. exaggerates
-
The __ nature of the data made it challenging to discern clear patterns in consumer behavior.
A. erratic
B. consistent
C. predictable
D. stable
-
The analyst __ the importance of considering seasonal variations when interpreting the sales data.
A. emphasized
B. downplayed
C. dismissed
D. overlooked
-
The report __ a comprehensive analysis of market trends over the past decade.
A. provides
B. withholds
C. distorts
D. fabricates
-
The __ between actual sales and projected figures was clearly visible in the comparison chart.
A. discrepancy
B. similarity
C. harmony
D. congruence
-
The market research team __ extensive data to support their conclusions about consumer preferences.
A. compiled
B. fabricated
C. overlooked
D. misinterpreted
-
The __ in the pie chart represents the percentage of market share held by new entrants.
A. segment
B. radius
C. diameter
D. circumference
-
The report __ several recommendations for improving market position based on the analyzed data.
A. offers
B. rejects
C. ignores
D. contradicts
-
The __ axis of the graph shows the percentage change in various economic indicators.
A. y
B. x
C. z
D. w
-
The scatter plot reveals a __ relationship between product price and sales volume.
A. inverse
B. direct
C. neutral
D. ambiguous
-
The analyst used a __ scale to better illustrate the small but significant changes in market share.
A. logarithmic
B. linear
C. exponential
D. nominal
-
The report __ the potential impact of emerging technologies on future market trends.
A. explores
B. disregards
C. minimizes
D. exaggerates
-
The __ in the graph indicates a period of rapid growth followed by a sudden decline.
A. spike
B. plateau
C. dip
D. curve
-
The market analysis __ both quantitative data and qualitative insights from industry experts.
A. incorporates
B. excludes
C. manipulates
D. misrepresents
-
The __ chart effectively displays the hierarchical structure of market segments and sub-segments.
A. tree
B. bubble
C. radar
D. funnel
-
The report __ several key performance indicators to assess the company’s market position.
A. utilizes
B. neglects
C. fabricates
D. misinterprets
-
The __ between different data sets in the graph highlights the interdependencies of various market factors.
A. correlation
B. disparity
C. inconsistency
D. irrelevance
-
The analyst __ the data to account for inflation and other economic factors before drawing conclusions.
A. adjusted
B. manipulated
C. distorted
D. ignored
-
The report concludes with a __ of potential scenarios for future market development based on current trends.
A. forecast
B. dismissal
C. misrepresentation
D. exaggeration
The line graph shows a steady __ in sales over the past quarter.
A. increase
B. decrease
C. fluctuation
D. stagnation
According to the pie chart, the largest market __ belongs to Company X.
A. share
B. segment
C. portion
D. slice
The bar graph __ the differences in revenue among the top five competitors.
A. illustrates
B. demonstrates
C. exhibits
D. portrays
The __ axis of the graph represents the time period in months.
A. vertical
B. horizontal
C. diagonal
D. perpendicular
The report indicates a __ correlation between advertising expenditure and sales growth.
A. positive
B. negative
C. neutral
D. inverse
The scatter plot __ a clear relationship between customer satisfaction and repeat purchases.
A. reveals
B. conceals
C. distorts
D. exaggerates
The __ point on the graph indicates the highest sales volume for the year.
A. peak
B. trough
C. median
D. mean
The trend line suggests a gradual __ in market share over the next five years.
A. expansion
B. contraction
C. stabilization
D. volatility
The histogram __ the distribution of customer ages across different product categories.
A. displays
B. hides
C. manipulates
D. misrepresents
The __ in the graph represents the point at which supply meets demand.
A. intersection
B. junction
C. crossroads
D. convergence
The report __ several key factors that contributed to the market’s growth.
A. identifies
B. ignores
C. overlooks
D. undermines
The area chart effectively __ the cumulative effect of multiple variables on total sales.
A. showcases
B. obscures
C. diminishes
D. exaggerates
The __ nature of the data made it challenging to discern clear patterns in consumer behavior.
A. erratic
B. consistent
C. predictable
D. stable
The analyst __ the importance of considering seasonal variations when interpreting the sales data.
A. emphasized
B. downplayed
C. dismissed
D. overlooked
The report __ a comprehensive analysis of market trends over the past decade.
A. provides
B. withholds
C. distorts
D. fabricates
The __ between actual sales and projected figures was clearly visible in the comparison chart.
A. discrepancy
B. similarity
C. harmony
D. congruence
The market research team __ extensive data to support their conclusions about consumer preferences.
A. compiled
B. fabricated
C. overlooked
D. misinterpreted
The __ in the pie chart represents the percentage of market share held by new entrants.
A. segment
B. radius
C. diameter
D. circumference
The report __ several recommendations for improving market position based on the analyzed data.
A. offers
B. rejects
C. ignores
D. contradicts
The __ axis of the graph shows the percentage change in various economic indicators.
A. y
B. x
C. z
D. w
The scatter plot reveals a __ relationship between product price and sales volume.
A. inverse
B. direct
C. neutral
D. ambiguous
The analyst used a __ scale to better illustrate the small but significant changes in market share.
A. logarithmic
B. linear
C. exponential
D. nominal
The report __ the potential impact of emerging technologies on future market trends.
A. explores
B. disregards
C. minimizes
D. exaggerates
The __ in the graph indicates a period of rapid growth followed by a sudden decline.
A. spike
B. plateau
C. dip
D. curve
The market analysis __ both quantitative data and qualitative insights from industry experts.
A. incorporates
B. excludes
C. manipulates
D. misrepresents
The __ chart effectively displays the hierarchical structure of market segments and sub-segments.
A. tree
B. bubble
C. radar
D. funnel
The report __ several key performance indicators to assess the company’s market position.
A. utilizes
B. neglects
C. fabricates
D. misinterprets
The __ between different data sets in the graph highlights the interdependencies of various market factors.
A. correlation
B. disparity
C. inconsistency
D. irrelevance
The analyst __ the data to account for inflation and other economic factors before drawing conclusions.
A. adjusted
B. manipulated
C. distorted
D. ignored
The report concludes with a __ of potential scenarios for future market development based on current trends.
A. forecast
B. dismissal
C. misrepresentation
D. exaggeration
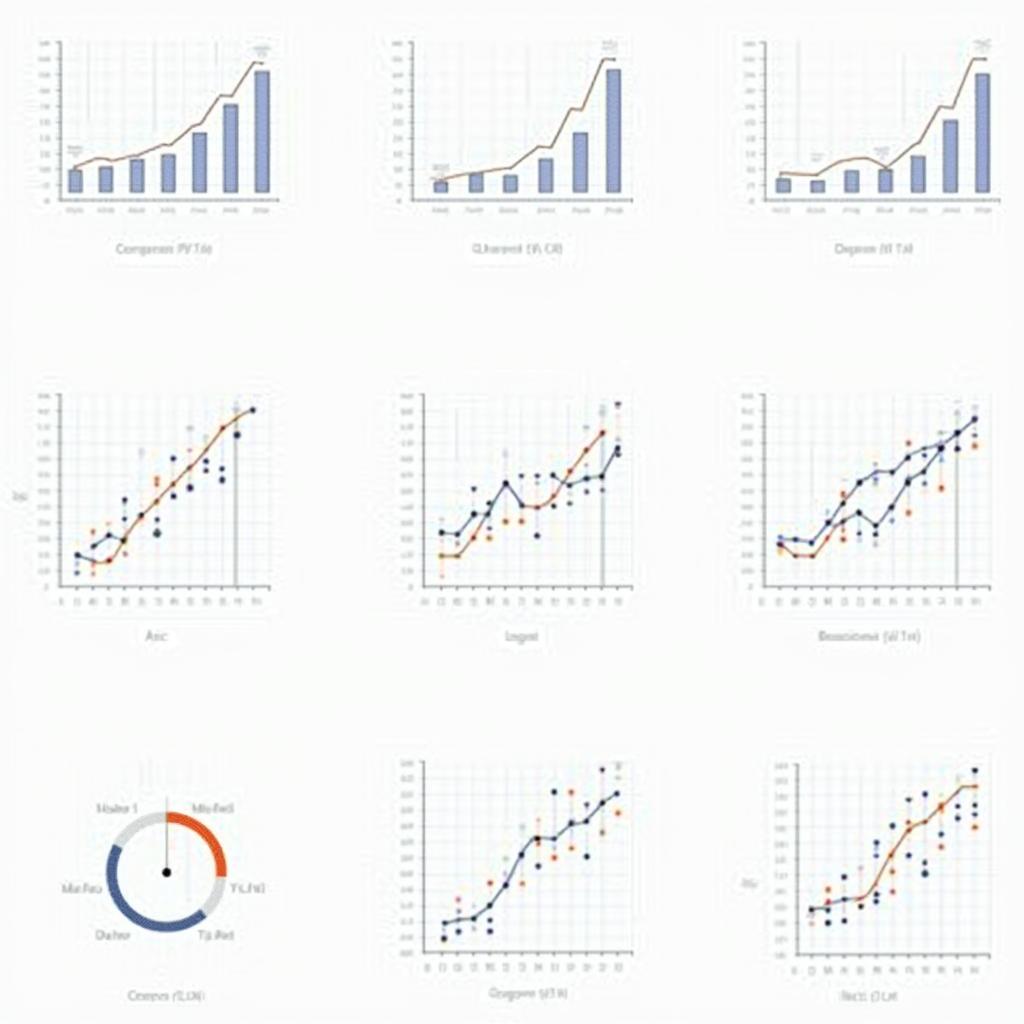 TOEIC Reading Practice: Graph Interpretation
Part 2: Text Completion
Questions 31-34 refer to the following text:
Market trend reports often rely heavily on graphical representations to convey complex information quickly and effectively. The ability to (31) these graphs is crucial for understanding market dynamics. Line graphs are particularly useful for showing (32) over time, such as changes in sales figures or stock prices. Bar charts, on the other hand, excel at comparing (33) between different categories or entities. Pie charts are ideal for illustrating (34) of a whole, such as market share distribution among competitors.
-
A. interpret
B. misinterpret
C. ignore
D. create -
A. trends
B. comparisons
C. proportions
D. hierarchies -
A. values
B. trends
C. segments
D. correlations -
A. proportions
B. trends
C. fluctuations
D. hierarchies
Questions 35-38 refer to the following text:
When analyzing market trend reports, it’s essential to consider the (35) of the data presented. Scatter plots can reveal (36) between two variables, helping analysts identify potential causal relationships. However, it’s important to remember that correlation does not always imply (37). Area charts are useful for showing how multiple variables contribute to a total, while stacked bar charts can illustrate both the total and the (38) of individual components over time.
-
A. context
B. irrelevance
C. manipulation
D. fabrication -
A. correlations
B. discrepancies
C. proportions
D. hierarchies -
A. causation
B. correlation
C. coordination
D. calculation -
A. composition
B. dissolution
C. stagnation
D. eradication
Questions 39-42 refer to the following text:
Interpreting graphs in market trend reports requires a keen eye for detail and an understanding of various statistical (39). For instance, when examining a line graph, it’s crucial to note the scale of the axes, as a (40) scale can sometimes exaggerate small changes. Similarly, in bar charts, it’s important to check whether the y-axis starts at zero, as a (41) axis can create a misleading visual impression. Analysts must also be aware of potential data (42) and consider the source and methodology behind the presented information.
-
A. concepts
B. misconceptions
C. manipulations
D. distortions -
A. logarithmic
B. linear
C. exponential
D. nominal -
A. truncated
B. extended
C. inverted
D. rotated -
A. biases
B. accuracies
C. validities
D. reliabilities
Questions 43-46 refer to the following text:
Advanced market trend reports often incorporate more complex graphical representations to convey multidimensional data. Bubble charts, for example, can display three variables simultaneously, using the x and y (43) for two variables and the size of the bubbles for a third. Heatmaps are excellent for showing (44) across two dimensions, often using color intensity to represent values. When interpreting these advanced charts, it’s crucial to pay close attention to the (45) and understand how each visual element corresponds to the underlying data. Analysts should also be prepared to (46) the graphs with additional contextual information and qualitative insights to gain a comprehensive understanding of market trends.
-
A. coordinates
B. intersections
C. dimensions
D. axes -
A. patterns
B. discrepancies
C. correlations
D. hierarchies -
A. legend
B. title
C. footnotes
D. bibliography -
A. supplement
B. contradict
C. disregard
D. manipulate
Answer Key
Part 1: Incomplete Sentences
- A
- A
- A
- B
- A
- A
- A
- A
- A
- A
- A
- A
- A
- A
- A
- A
- A
- A
- A
- A
- A
- A
- A
- A
- A
- A
- A
- A
- A
- A
Part 2: Text Completion
- A
- A
- A
- A
- A
- A
- A
- A
- A
- A
- A
- A
- D
- A
- A
- A
 TOEIC Reading Answer Sheet
This practice test focuses on interpreting graphs in market trend reports, a crucial skill for professionals in business and finance. By working through these questions, test-takers can improve their ability to analyze and understand complex data presentations, enhancing their performance in the TOEIC Reading section and their overall comprehension of business-related materials.